
Katherine Blood
We have developed a new measure tracking UK commercial real estate (CRE) ownership at property level, mapping the latest investor landscape at end-2025 Q3 and its shift since the pandemic. Our estimates show a diversified, international base: overseas investors hold around one third of UK CRE, while private equity funds own 8% after post-pandemic growth. Investor-owned CRE has tilted towards warehouses, logistics, rental housing and properties serving innovation-led sectors – like data centres and life-sciences. Why does this matter? CRE ownership shapes how shocks play out – affecting refinancing waves, upgrade costs and valuation swings. History shows the sector has seen boom-bust cycles before and contributed to financial stability challenges in the UK and abroad.
How can we track who owns UK CRE – and why does it matter?
Public statistics on who owns UK CRE are limited and rely on lagged balance sheet data. Our new measure estimates the stock of UK CRE held by different investor groups from 2016 to 2025 Q3, using MSCI transaction and fund level data, supplemented by IPF data on high-net-worth holdings and owner occupiers, indexed to UK CRE prices. It offers a granular perspective and lets us track ownership patterns typically within days of a verified transaction, rather than waiting for infrequent company financial reports. We have a clearer picture of who owns what – and how it is changing – across the UK’s commercial property market. We cross-validated our approach against IPF Size and Structure Report (year end-2023) and found close alignment. Devaney and Scofield (2021) applied a similar method to global cities, while our measure captures the UK as a whole.
Why does ownership structure matter?
Who owns CRE shapes how stress spreads to the financial system. Historical episodes show that leveraged or short-horizon owners can accelerate downturns. Today, risks flow through banks, non-bank investors, and collateral channels – while structural shifts and climate transition pressures test the capacity of owners to adapt. Understanding ownership patterns helps policymakers assess where vulnerabilities sit and how they might evolve.
CRE shocks can propagate through a number of channels:
- Structural transition: CRE is undergoing structural change – hybrid working has dampened office demand, e-commerce has reshaped retail, and demand for logistics, data centres and life-science labs is rising. Ownership will shape the future stock: long-term investors may fund retrofits for the push to net-zero, while short-horizon owners may defer them – determining which buildings survive and which risk becoming stranded. This matters for both financial stability and wider economic outcomes.
- Bank resilience: Owners facing refinancing pressures – for example, in offices and retail sectors with lower post-pandemic capital values – could expose bank lenders to losses. Though, this is unlikely to threaten overall resilience, as UK banks have reduced direct CRE exposures and proved resilient in recent stress tests.
- Non-banks: A growing share of CRE is held by non-bank institutions – such as funds, real estate investment trusts (REITs) and private firms – this has brought fresh capital and diversified ownership. But some structures can amplify stress. Highly leveraged investors with predetermined lifecycles, or open-ended funds facing redemptions, may be vulnerable to fire-sales that deepen downturns. This was evident in 2016, when several UK open-ended property funds froze redemptions to avoid forced selling after withdrawals surged post-referendum.
- Collateral: CRE is widely used as corporate loan collateral; falling property values can constrain investment that supports economic growth. Well-capitalised owners may continue spending, but leveraged investors are more likely to retrench, deepening downturns.
What does the big picture look like currently?
Our measure helps map risks to specific ownership patterns by revealing how UK CRE has evolved over the past decade:
Market size: The UK CRE stock is estimated to stand at £1.1 trillion. Investable CRE –properties rented to businesses – has grown in prominence, with domestic and foreign investors now holding close to two thirds of the market (Chart 1), up 7% since 2016 to £711 billion. In contrast, owner-occupier holdings (companies that own their premises) account for around only one third. This highlights the growing role of capital markets – particularly vehicles like REITs and private funds – that have helped enable investor access.
Chart 1: UK CRE ownership stock at end-2025 Q3
Internationalisation: Foreign ownership has increased markedly. Overseas investors now own 46% of invested UK CRE and 29% of the total stock – up from 24% a decade ago and 27% in 2020. This represents a 19% rise in foreign-held assets since 2016, from £271 billion to £324 billion, embedding global capital into UK CRE. US investors have led this trend, increasing their holdings by 38% over the past decade to account for 16% of the invested stock, followed by Asian (14%), European (11%), and Canadian (2%) owners (Chart 2).
Chart 2: Invested UK CRE ownership shares by investor nationality
Sectoral composition: The UK CRE stock has shifted over the last decade (Chart 3), with offices still largest and retail holding a substantial share, but both in decline. Offices have edged down from 41% to 31%, shaped by hybrid working and decarbonisation costs. Retail has fallen from 27% of the stock to 16%, reflecting the rise of e-commerce. Industrial has grown from 14% to 28%, driven by logistics and warehouse demand, while residential has doubled to 15%. Beneath these headline categories, investor interest is increasingly flowing to specialised segments – such as data centres and life-sciences. These are difficult to isolate because they sit within broader industrial and office classifications, yet they are attracting significant capital. These changes point to a structural rebalancing towards assets aligned with technology, sustainability, and evolving usage.
Chart 3: Change in share of invested UK CRE stock since 2016 by property type
What has changed since 2020?
The pandemic marked a turning point in ownership patterns – our estimates capture how the investor landscape responded:
Diversification: Our estimates show that foreign investors did not retrench completely post-pandemic – they diversified. Pre-pandemic, overseas buyers concentrated on London offices, which made up around 43% of their UK holdings. That share has declined to 34%, while exposure to industrial and residential assets outside London has risen from 8% to 19% and 6% to 11%, respectively (Chart 4). This reflects a search for yield in growth sectors and a response to rising structural demand for warehouse space – driven by the surge in online shopping which spurred expansion of the Midlands’ ‘Golden Triangle’ as Britain’s logistics hub.
Chart 4: Relative growth of foreign-owned UK CRE stock located inside and outside London
Private-market investors. Private equity now accounts for 8% of UK CRE – making it the joint largest owner alongside REITs (Chart 1). This marks the sector’s growing operational complexity, which favours active asset management strategies such as those pursued by value-add funds (which improve or repurpose assets) and direct private investors, rather than passive ownership. It also reflects a broader transition in the CRE funding landscape toward market-based finance amid rising debt appetite from private equity funds.
Growth has been driven by foreign capital, particularly from the United States. Since the pandemic, foreign private equity funds increased their UK CRE holdings by 34%, making them the fourth-largest owner overall. US-based funds hold 56% of all private equity owned assets, while UK-based funds hold most of the remainder (Charts 5 and 6).
Since 2020, exposures have tilted toward industrial and residential sectors, now 55% of private equity-owned UK CRE (up from 21%), while offices and retail have fallen from 59% to 33%. Geographically, acquisitions span the UK, with a rising share in regional markets where valuations offer scope for value-add strategies (Chart 7).
Chart 5: Private equity ownership of UK CRE
Chart 6: Composition of private equity fund UK CRE ownership
Chart 7: Relative growth of private equity owned UK CRE stock
The rise of data centres. Data centres have emerged as the fastest-growing segment of UK CRE, reflecting the economy’s shift toward digital infrastructure (Chart 8). Data classification makes it hard to measure absolute stock estimates, as data centre exposure is often embedded within the broader ‘Industrials’ category. From what we can identify, the stock has expanded by around threefold since 2016, with growth accelerating post-2020 as demand for cloud services and AI rose.
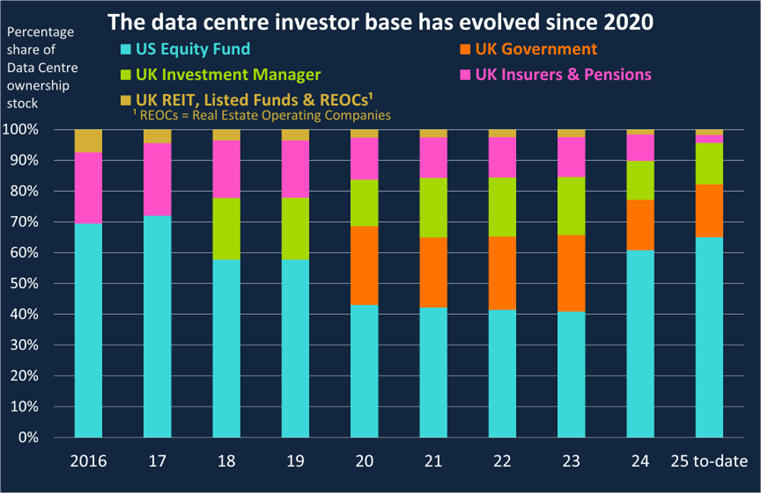
The UK data centre investor base has evolved since 2020 (Chart 9). UK government participation has grown, likely reflecting strategic infrastructure priorities, while UK investment managers have maintained a steady share since 2018. UK insurers and pension funds have scaled back, with declines accelerating since 2020. US-based private equity funds remain substantial, and their share has increased in recent years. The combination of public sector involvement and sustained UK Investment management flows signals some diversification at the margin alongside the gradual reallocation of capital towards data-driven assets.
As digitalisation deepens, data centres are likely to play a bigger role in CRE portfolios and the wider UK economy. Yet, rapid growth raises questions about whether current enthusiasm reflects long-term fundamentals. Valuations and investor expectations have risen quickly, but efficiency gains and cost structures – particularly around energy use – are still evolving. This creates a risk that anticipated returns may outpace the sector’s ability to deliver, especially as uncertainty remains over how energy-intensive assets will be financed. That said, this is a structural shift, reflecting strong demand for UK digital infrastructure and channelling capital into the economy which may support longer-term growth.
Chart 8: Relative growth of UK CRE across property types
Chart 9: UK data centre investor base
The big takeaway
Ownership matters because it shapes how risks and opportunities flow through the financial system and the real economy. Our new measure shows UK CRE is increasingly market-based, internationally owned and structurally shifting toward sectors like logistics, rental housing and data-driven assets. These changes bring resilience through diversification, but also new potential risk channels and transition challenges. Understanding who owns the buildings where Britain shops, works and stores its data is essential for assessing vulnerabilities – and for ensuring that capital continues to support sustainable growth.
Katherine Blood works in the Bank’s Macro-Financial Risk Division.
If you want to get in touch, please email us at [email protected] or leave a comment below.
Comments will only appear once approved by a moderator, and are only published where a full name is supplied. Bank Underground is a blog for Bank of England staff to share views that challenge – or support – prevailing policy orthodoxies. The views expressed here are those of the authors, and are not necessarily those of the Bank of England, or its policy committees.
Share the post “Who owns the buildings where Britain shops, works – and stores its data?”
Publisher: Source link


