
Iulia Bucur and Ed Hill
Modern language models – think OpenAI’s GPTs, Google’s Gemini or DeepSeek – are powerful tools: but how can we use them in economic policymaking? Economic analysis often relies on decompositions to understand macroeconomic data and inform counterfactuals. But these decompositions are typically obtained from numerical data or macroeconomic models and so may overlook nuanced insights embedded in unstructured text. We propose decomposing the metrics which Large Language Models (LLMs) can derive from text data to offer insights from large collections of documents in a highly interpretable format. This approach aims to bridge the gap between natural language processing (NLP) techniques and economic decision-making, offering a richer, more context-aware understanding of complex economic phenomena.
Decompositions and economic analysis
Decompositions are frequently used in economic analysis to inform policy. They tell stories about why variables of interest, such as inflation, evolve in a particular way. Decompositions are sometimes derived through additive methods, where all components sum up to a variable of interest. They can also arise from models of the economy and describe the ‘shocks’ or ‘factors’ pushing macroeconomic variables away from their equilibrium (as in recent Bank staff research, Chart 1). This blog post instead focusses on decomposing documents’ sentiment by topic.
Chart 1: Decomposition of one month ahead CPI inflation from Buckmann et al (2025)
A short primer on sentiment and topic analysis
The original way to determine sentiment and topic was using lexicons – lists of words whose presence in a sentence indicated whether it had a certain topic (eg ‘workforce’ or ‘employment’ for labour) or sentiment (eg ‘good’ for positive, ‘bad’ for negative). However, this method fails for more nuanced language, where the position and meaning of words relative to each other is important (eg ‘It is not good that inflation is increasing’).
A half century of NLP innovation has culminated in large language models. They excel at extracting meaning from complex, layered sentences and can be used to classify text into specific categories – such as topic, sentiment, tense, being ironic, or being hate speech – with unprecedented accuracy.
Applying LLMs to gauge sentiment
We use the Bank of England’s Monetary Policy Reports (MPRs) from 1997–2024 and the Bank of Japan’s Outlook for Economic Activity and Prices (OEAP) from 2000–24. For the MPRs, we use the analogous Inflation Reports (IRs) prior to November 2019 (beginning in 1997 when they became available in a native digital format). These documents were chosen as they are publicly available, comparable in content and from two jurisdictions with different economic and geopolitical contexts; this allows us to investigate similarities and differences in topics and sentiments over time. This blog post is an exercise in the application of NLP techniques, not a commentary on the two institutions’ policies.
In this case, we trained custom sentiment and topic classifiers using LLM-generated text embeddings (numerical representations that capture the meaning of a sentence) of sentences from both the MPR and OEAP. Similar sentences, even if phrased differently, will have similar embeddings and so can be put into the same category by our classification model.
Using sentence-level classifications, we compute the sentiment score for each date by summing the sentiment scores of all sentences associated with that date (ranging between -1 for negative and 1 for positive). The score is then normalised by document length and the long-run average is subtracted. The results can be seen in Chart 2.
Chart 2: Aggregate sentiment over time in the MPR and OEAP
However, communicating sentiment analysis results in this way tends to obscure the benefits of using better models. The line charts produced have a habit of showing obvious movements that are correlated with GDP growth. For example, the sentiment score decreases during the 2007–08 global financial crisis (GFC) and the Covid pandemic, as expected. Moreover, while the chart captures other movements of a similar magnitude – in the late 1990s in the UK, for example – it gives no indication as to the likely drivers behind them.
All downturns are different
In Chart 3, we see the more interesting effects conveyed in a sentiment decomposition. Here, we calculate the sentiment score for each date and topic using the same method within sentences relating to a particular topic as we did for the overall sentiment calculation above. This score gives the size and direction of a bar, where positive scores are associated with positive sentiment and vice versa. The same decomposition methodology is used for both the OEAP and MPR.
Chart 3: Sentiment decomposition over time for the OEAP and the MPR
‘Prices’ and ‘trade’ are discussed in a negative light in both the MPR and the OEAP around the GFC. However, the relative sizes of the sentiment scores differ – for example, the ‘banking’ component appears to be more negative for the MPRs than for the OEAPs published during this period, and ‘production & consumption’ the opposite. Underlying text supports this: the November 2008 IR leads with the conditions in financial markets, perhaps unsurprisingly given the importance of the financial sector at the time. In contrast, the October 2008 OEAP leans towards the effects in the real economy driven by a global financial situation.
The sentiment decomposition shows that while OEAP sentiment rebounded to more positive levels around April 2010, it remained largely subdued in the MPR in the following years. This corresponds to a narrative of quick recovery in the April 2010 OEAP, driven largely by strong demand from China and other emerging economies. In contrast, the UK recovery was judged to be slow in the February 2010 IR pre-empting lingering worries about ‘production & consumption’ (eg August 2012 IR). This is masked in the aggregate sentiment by the increasingly positive view on the near-target inflation at that time following the peak in 2011.
That peak was judged to be due to an energy and import price shock and was messaged, with little negative sentiment, as being transitory provided that inflation expectations did not rise (August 2011 IR). In Japan, there was a large rise in inflation with positive messaging preceding and during it, a symptom of the Bank of Japan’s measures to push the Japanese economy out of prolonged low inflation stagnation via quantitative easing (April 2013 OEAP).
We can also see the different effects of the pandemic and the energy price shock in 2022. There was a drop in sentiment in late 2019 in the UK with the ‘trade’, ‘production’ and ‘banking’ components falling around Brexit, and a similar trade-related dip in Japan in 2019 around the US–China trade tensions.
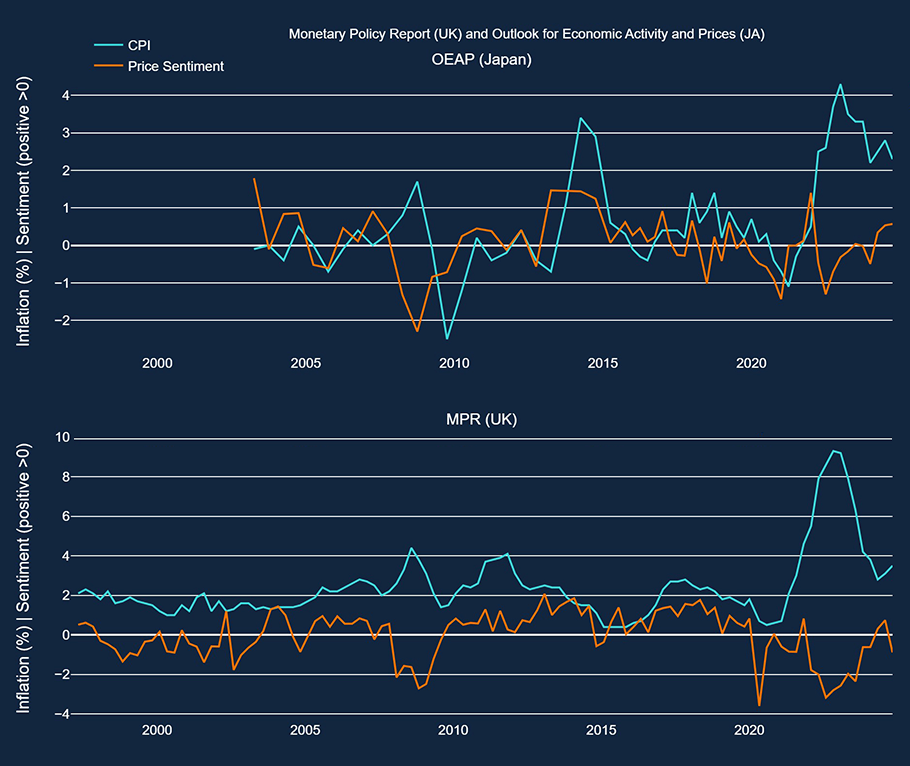
In Chart 4, we look at the longer-run comparison between a single topic’s sentiment and its corresponding macroeconomic variable – the topic of ‘prices’ and CPI inflation. Both central banks’ messaging generally becomes more negative as inflation deviates significantly from target.
Chart 4: Comparing CPI inflation to sentiment for the topic of ‘prices’
Some key considerations
LLMs are not a magic bullet, and carefully choosing and validating the models used is crucial, particularly if these are off-the-shelf solutions. Generic models sometimes struggle to correctly identify the polarity and nuance of economic text. Moreover, even models trained on financial text can incorrectly link the direction of a change to the sentiment, having learned the pattern that profits, shares etc rising is generally positive. Instead, for both topic and sentiment, we trained simple linear classification models on sentence embeddings. For the target, we used a GPT model to label a subsample of the sentences from both sets of documents.
Similarly, keeping a ‘human-in-the-loop’ who brings domain knowledge about the content and structure of the documents remains important. While techniques such as sentiment decomposition help to better communicate NLP insights, domain experts should still be involved in the formulation of the problem and the interpretation of the results. This is also likely to strengthen the models themselves.
Policy implications
We have shown how sentiment decomposition can enhance the identification and explanation of the impact of global shocks on different jurisdictions. Similar decompositions can help monetary policy makers understand the views of other countries’ central banks, much like they do with other economic indicators. Additionally, decompositions can help officials see how their own behaviour has evolved over time. More broadly, this approach can help monetary policy makers in forming a more comprehensive understanding of economic conditions. By modelling and decomposing sentiment in other sources such as news or social media, we can capture topics that are not immediately reflected in numerical data but may be embedded in that unstructured information. Such insights can complement information from traditional statistical sources, helping decision-makers set policies accordingly.
This approach can also be used in other central banking settings, such as analysing documents from regulated financial institutions to help supervisors quickly spot trends or outliers. Additionally, sentiment decomposition can support other directional classifications, like decomposing sentiment by tense to determine whether attitudes stem from past events, current conditions, or future expectations.
Conclusion
Sentiment decomposition brings together modern NLP techniques with visualisation methods often used in economic analysis. It strikes a balance between highly detailed analysis, which often requires painstaking manual effort, and high-level insights, which can be generated more easily but tend to be narrative rather than quantifiable in nature. Decomposing sentiment by topic provides a way to leverage the performance of the newest LLMs while still presenting results in a numerical format.
Iulia Bucur works in the Bank’s Insurance Analytics Division and Ed Hill works in the Bank’s Advanced Analytics Division.
If you want to get in touch, please email us at [email protected] or leave a comment below.
Comments will only appear once approved by a moderator, and are only published where a full name is supplied. Bank Underground is a blog for Bank of England staff to share views that challenge – or support – prevailing policy orthodoxies. The views expressed here are those of the authors, and are not necessarily those of the Bank of England, or its policy committees.
Share the post “All shocks are different: insights from sentiment and topic analysis using LLMs”
Publisher: Source link


